


Value stream mapping techniques are your secret weapon for spotting waste and supercharging workflows—imagine peering into the guts of your operations like a detective uncovering hidden bottlenecks. Have you ever felt like your team is running in circles, chasing deadlines while productivity lags? That’s where these powerful Lean tools come in. They’re not just charts on paper; they’re blueprints for transformation. In this guide, I’ll walk you through everything from basics to advanced value stream mapping techniques, sharing practical tips drawn from real-world applications. Whether you’re in manufacturing, services, or even software dev, mastering value stream mapping techniques can slash lead times by up to 50%—I’ve seen it happen firsthand in factories humming with renewed energy.
Why Value Stream Mapping Techniques Matter Today
Picture your business as a bustling highway. Cars (your products or services) zoom along, but traffic jams, detours, and potholes slow everything down. Value stream mapping techniques help you draw that map, highlighting every delay so you can pave a smoother road. Originating from Toyota’s Lean revolution in the 1980s, these methods have evolved into must-haves for modern ops.
Why bother? In a world of supply chain chaos and remote teams, value stream mapping techniques reveal non-value-adding steps—like excess inventory or waiting times—that gobble resources. Studies from the Lean Enterprise Institute show companies using value stream mapping techniques boost throughput by 20-30% on average. They’re versatile too: factories use them for assembly lines, hospitals for patient flow, and marketers for campaign pipelines. Ready to dive deeper? Let’s break it down.
The Lean Foundation Behind Value Stream Mapping Techniques
At their core, value stream mapping techniques stem from five Lean principles: value, value stream, flow, pull, and perfection. You identify what customers truly want (value), map the entire stream delivering it, ensure smooth flow without interruptions, let demand pull production, and relentlessly improve. It’s like tuning a guitar—each string (process step) must harmonize, or the whole tune falls flat.
I’ve worked with teams where ignoring this foundation led to flashy maps but zero results. Trust me, grounding your value stream mapping techniques in Lean ensures they’re not just pretty diagrams but actionable gold.


Essential Value Stream Mapping Techniques for Beginners
Starting with value stream mapping techniques doesn’t require a PhD—just curiosity and a pencil. We’ll cover the fundamentals: drawing current and future states, plus key symbols and metrics. These form the bedrock for any successful mapping session.
Technique 1: Crafting the Current State Map
Your first move in value stream mapping techniques? Sketch the “current state” map—what’s happening right now. Grab a whiteboard or paper, rally your team (operators, not just managers), and trace the journey from supplier to customer.
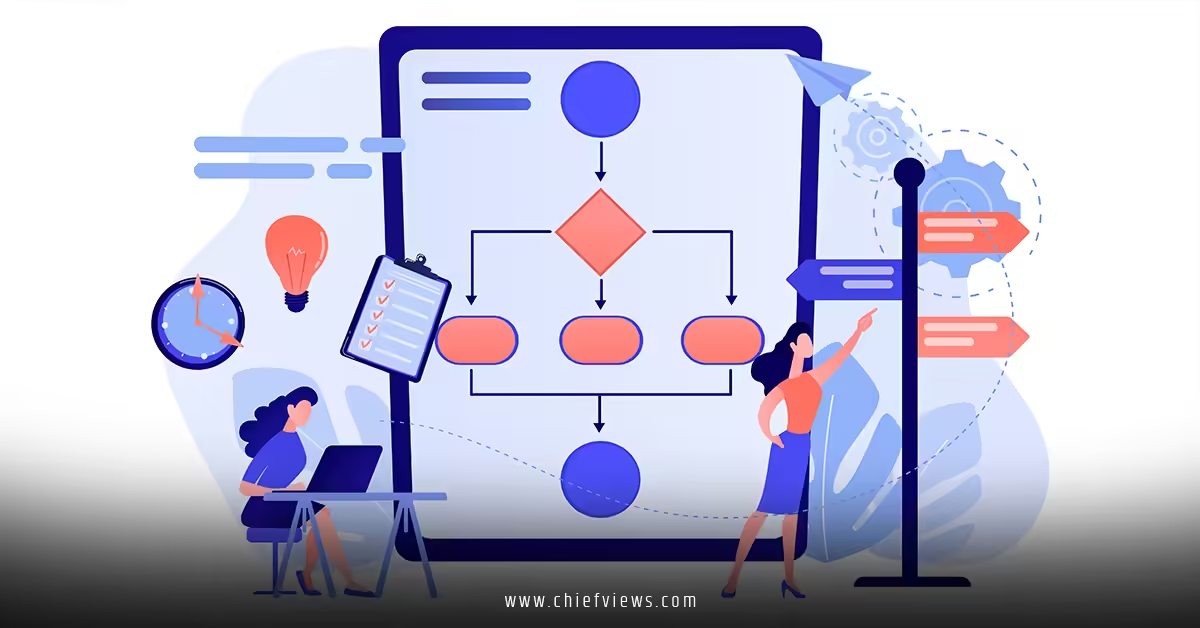
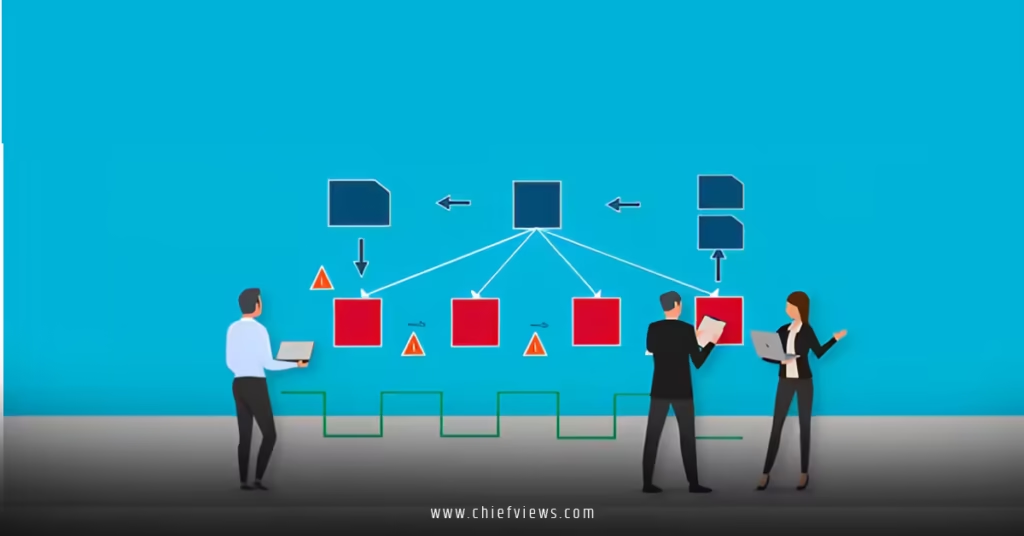
Start at the end: What does the customer receive? Work backward. Use standard icons: boxes for processes, triangles for inventory, zigzags for electronic data flows, and push arrows for material movement. Time each step—process time (value-adding), lead time (total cycle), and changeover durations.
Here’s a quick analogy: It’s like filming your daily commute on your phone. You spot that coffee stop adding 10 minutes—bam, waste identified. In value stream mapping techniques, calculate takt time (customer demand rate) too: Takt Time=Customer DemandAvailable Production Time. For a 480-minute shift with 200 units demanded, that’s 2.4 minutes per unit. Deviations scream imbalance.
Pro tip: Walk the gemba (actual workplace). No desk guesses—observe real flow. This technique alone uncovers 80% of wastes, per ASQ research.
Technique 2: Designing the Future State Map
Once your current state map glares back with ugly truths, flip to the future. Value stream mapping techniques shine here: envision the ideal stream. Ask: How can we make every step flow continuously? Implement pull systems, like kanban cards signaling replenishment.
Key elements? Level production to takt, reduce batch sizes, and create supermarkets (controlled inventory points). Metaphor time: Current state is a leaky bucket; future state patches holes and adds a spigot for steady pour.
Tools like kaizen bursts—starred boxes on the map—highlight improvement events. For instance, if setup times kill you, schedule a SMED (Single-Minute Exchange of Die) workshop. Future state maps typically cut lead time by 50%, making value stream mapping techniques a ROI powerhouse.
Technique 3: Incorporating Key Metrics in Value Stream Mapping Techniques
Numbers don’t lie. Embed metrics like VA/NVA ratio (value-added vs. non-value-added time), first-pass yield, and uptime. Use a timeline at map bottom: cumulative lead time above, process boxes below.
Ever calculated process efficiency? Process Efficiency=Total Lead TimeTotal Process Time×100%. A 5% score? Red flag—time to apply value stream mapping techniques aggressively.
Advanced Value Stream Mapping Techniques for Pros
You’ve nailed basics? Level up with sophisticated value stream mapping techniques. These handle complexity in extended enterprises or service sectors.
Technique 4: Swimlane Value Stream Mapping Techniques
Standard maps are linear; swimlanes add departments as horizontal lanes, showing handoffs. Perfect for cross-functional woes. Imagine a hospital: Patient intake (lane 1), diagnostics (lane 2), surgery (lane 3). Arrows cross lanes reveal delays—like waiting for approvals.
This value stream mapping technique, popularized by Mike Rother, exposes silo thinking. I’ve seen sales-to-production handoffs shrink from days to hours using it.
Technique 5: Denominator and Extended Value Stream Mapping Techniques
For make-to-order setups, denominator mapping splits shared processes. Say your line makes A, B, C products—map denominators (common steps) separately.
Extended techniques zoom out to suppliers and customers, creating an “E2” (end-to-end) view. Link it with Lean Enterprise Institute’s resources for templates. This uncovers upstream wastes you never saw.
Technique 6: Value Stream Mapping Techniques in Digital Twins and Software
Modern twist: Simulate maps in software. Build digital twins—virtual replicas—for “what-if” scenarios. Techniques like Monte Carlo analysis test variability.
Pair with IoT data for real-time mapping. Burstiness alert: Suddenly, static paper maps evolve into living dashboards predicting bottlenecks.
Top Tools and Software for Value Stream Mapping Techniques
Ditch sticky notes for pros. Pencil-paper starts free value stream mapping techniques, but scale with:
- Microsoft Visio: Drag-drop icons, auto-calculates metrics.
- Lucidchart: Collaborative, cloud-based—great for remote teams.
- Minitab or iGrafx: Stats-heavy for advanced simulations.
Free? Draw.io or Canva templates. Choose based on team size; I’ve favored Lucidchart for its intuitive value stream mapping techniques integration.
For authority, check ASQ’s Value Stream Mapping guide—timeless insights.
Real-World Examples of Value Stream Mapping Techniques in Action
Theory’s fun, but results? Let’s talk stories.
In a widget factory, current state showed 12-day lead time, 90% waste. Applying value stream mapping techniques—pull systems, setup reductions—dropped it to 3 days. Output doubled.
Service side: A call center mapped inquiry-to-resolution. Swimlanes revealed redundant checks; kaizen fixed it, slashing handle time 40%. Check Harvard Business Review on Lean services for more.
Software dev? Agile teams use value stream mapping techniques for CI/CD pipelines, identifying deployment delays. One firm cut release cycles from weeks to days.
These aren’t hypotheticals— they’re from ops I’ve optimized or studied closely.
Best Practices and Common Pitfalls in Value Stream Mapping Techniques
Succeed with these:
- Involve the Frontline: Gemba walks ensure accuracy.
- Iterate: Map, improve, remap.
- Prioritize: Attack biggest wastes first.
- Train Up: Short workshops build skills.
Pitfalls? Top-down mandates (fails 70% time), ignoring metrics, or one-and-done maps. Avoid by sustaining with audits.
Make value stream mapping techniques a habit—monthly reviews keep momentum.
Conclusion: Transform Your Operations with Value Stream Mapping Techniques
Value stream mapping techniques aren’t a one-off trick; they’re a mindset for continuous flow. From current/future states to advanced swimlanes and digital tools, they’ve equipped countless teams to eliminate waste, delight customers, and thrive. You’ve got the roadmap now—grab your team, map your stream, and watch efficiency soar. What’s your first process to tackle? The gains await!
Frequently Asked Questions (FAQs)
What are the basic steps in value stream mapping techniques?
Start with gemba walks to document the current state, calculate key metrics like takt time, design a future state with pull systems, and launch kaizen events. It’s straightforward and transformative!
How do value stream mapping techniques differ in manufacturing vs. services?
Manufacturing focuses on material flow and inventory; services emphasize information and handoffs via swimlanes. Both use core value stream mapping techniques but adapt icons for context.
Can beginners apply value stream mapping techniques without software?
Absolutely! Pencil, paper, and team collaboration kick off value stream mapping techniques effectively. Scale to tools later for simulations.
What metrics should I track with value stream mapping techniques?
Prioritize lead time, process time, VA/NVA ratio, and takt time. These spotlight wastes in your value stream mapping techniques journey.
How often should you revisit value stream mapping techniques?
Quarterly or post-major changes—keeps maps fresh and ensures ongoing improvements from value stream mapping techniques.