


How to Calculate WACC and Set Capital Cost Benchmarks—your weighted average cost of capital—is how you determine what your company’s money actually costs to deploy. It’s the financial bedrock underneath every capital decision, the number that tells you whether a 12% return is spectacular or mediocre. Without it, you’re setting hurdle rates blind. With it, you’re building a CFO investment analysis framework for decision making that stands on solid ground.
Here’s the uncomfortable truth: most CFOs inherit hurdle rates from predecessors or copy competitors without ever truly calculating their own WACC. Then they wonder why their capital allocation decisions feel disconnected from reality.
Why WACC Matters: The Quick Frame
WACC answers one deceptively simple question: What’s the minimum return this company must generate to satisfy both its debt holders and equity investors?
If your WACC is 8%, any investment returning less than 8% destroys shareholder value. Any investment returning more than 8% creates it. Everything else flows from that single number.
• WACC is your financial hurdle rate baseline—below it, capital allocation destroys value; above it, value compounds • It reflects your capital structure—how much you fund via debt versus equity, and the cost of each • It’s industry and company specific—a utility company’s WACC looks nothing like a software company’s • It sets the tone for your CFO investment analysis framework for decision making—get this number wrong, and your entire approval matrix is compromised • It changes with market conditions—interest rates shift, credit spreads widen, equity risk premiums fluctuate; your WACC must track reality


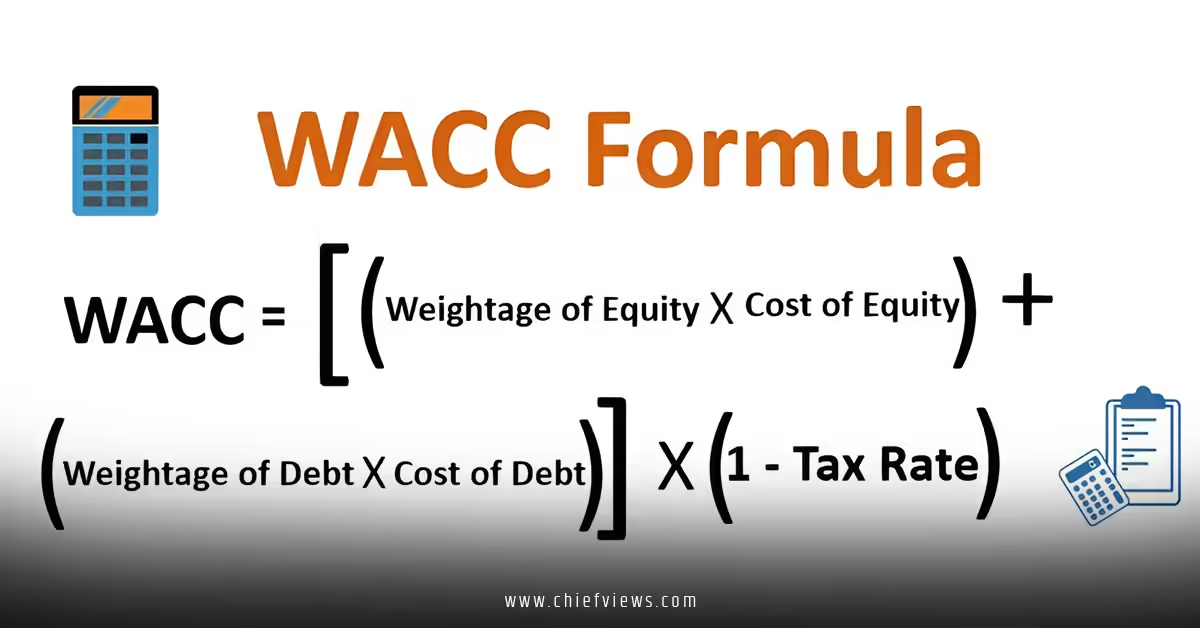
The WACC Formula: Deconstructed
Here’s the formula. Don’t panic—we’ll walk through it step by step.
$$WACC = \left(\frac{E}{V} \times Re\right) + \left(\frac{D}{V} \times Rd \times (1 – Tc)\right)$$
Breaking this down:
• E = Market value of equity (shares outstanding × current stock price) • D = Market value of debt (not book value; what the debt would sell for today) • V = Total value (E + D) • Re = Cost of equity (what investors demand to own your stock) • Rd = Cost of debt (interest rate on your debt) • Tc = Corporate tax rate (taxes reduce the cost of debt, since interest is tax-deductible)
The formula says: “Blend your cost of equity and cost of debt, weighted by how much you use each, adjusting for the tax shield.” That’s it.
Step 1: Calculate the Market Value of Equity (E)
This is the easy one—if you’re public.
For public companies:
Current stock price × shares outstanding = market cap. Done.
If your stock trades at $45 and you have 50 million shares outstanding:
$$E = $45 \times 50,000,000 = $2.25 \text{ billion}$$
For private companies:
Use a recent valuation from a funding round, acquisition comparable, or appraisal. Not perfect, but defensible. If your last Series B valued the company at $150 million, use that. If you’re pre-funding, use a multiple of EBITDA or revenue based on comparable private companies in your space.
Step 2: Calculate the Market Value of Debt (D)
Here’s where most CFOs slip up: they use book value from the balance sheet. Wrong.
Use market value—what your debt would sell for today in the open market.
If you have publicly traded bonds:
Bond price × par value = market value. Your treasurer probably has this data. If a $500M bond issue trades at 102% of par, its market value is $510M.
If you have private debt (bank loans, bonds not publicly traded):
Use yield-to-maturity (YTM) to estimate current market value. Or approximate: if your debt trades at similar spreads to comparable public companies, estimate the current market price based on interest rate movements since issuance.
If you’re carrying multiple debt instruments:
Add them all together. $200M in bank debt + $300M in bonds + $50M in lease obligations = $550M total debt.
Reality check: If your book value of debt is dramatically different from market value, something important is happening. Fixed-rate debt in a rising-rate environment is worth less; in a falling-rate environment, it’s worth more.
Step 3: Calculate the Cost of Equity (Re)
This is the trickiest component. You can’t observe it directly like you can a bond yield. You have to estimate it.
The Capital Asset Pricing Model (CAPM) is the industry standard:
$$Re = Rf + \beta \times (Rm – Rf)$$
Where:
• Rf = Risk-free rate (typically the yield on 10-year U.S. Treasuries; currently around 4.2–4.5% in 2026) • β (Beta) = Your company’s systematic risk relative to the overall market (1.0 = market risk; >1.0 = riskier; <1.0 = less risky) • Rm = Expected market return (historical equity returns average 10–11%; forward-looking estimates vary; many use 10%) • Rm – Rf = Market risk premium (difference between market return and risk-free rate; typically 5–6%)
Example calculation:
Assume:
- Rf = 4.3% (10-year Treasury yield)
- β = 1.2 (your company is 20% riskier than the market)
- Rm = 10% (expected market return)
- Market risk premium = 5.7% (10% – 4.3%)
$$Re = 4.3% + 1.2 \times 5.7% = 4.3% + 6.84% = 11.14%$$
Where do you get beta?
For public companies: Bloomberg, Yahoo Finance, or your brokerage platform pulls it directly. For private companies: find three to five public comparables in your industry and average their betas. It’s not perfect, but it’s workable.
The risk-free rate matters more than you think. In 2024, it was 4.0%. In 2026, it might be 4.5% or 3.8% depending on Fed policy. Recalculate annually.
Step 4: Calculate the Cost of Debt (Rd)
This is straightforward: Rd is your blended interest rate across all debt.
If you have:
- $200M of debt at 4.5%
- $300M of debt at 5.2%
Your blended cost of debt is:
$$Rd = \frac{($200M \times 4.5%) + ($300M \times 5.2%)}{($200M + $300M)} = \frac{$9M + $15.6M}{$500M} = 4.92%$$
Pro tip: Use your credit default swap (CDS) spread if you have one. A CDS spread reflects what the market thinks your credit risk actually is—sometimes more accurate than your stated coupon rate, especially if rates have moved significantly since you issued.
Step 5: Determine Your Tax Rate (Tc)
Use your effective tax rate, not your statutory rate.
Look at your last three years of tax returns or 10-K filings (if public). Calculate:
$$\text{Effective Tax Rate} = \frac{\text{Income Taxes Paid}}{\text{Pretax Income}}$$
If your company paid $30M in taxes on $100M in pretax income, your effective rate is 30%.
Why does this matter? Debt interest is tax-deductible. If you pay $50M in interest annually and your effective tax rate is 25%, you save $12.5M in taxes. The formula captures this benefit: (1 – Tc) reduces the after-tax cost of debt.
Step 6: Weight Everything and Calculate WACC
Now plug it all into the formula.
Example scenario:
- Market value of equity (E) = $2.25 billion
- Market value of debt (D) = $500 million
- Total value (V) = $2.75 billion
- Cost of equity (Re) = 11.14%
- Cost of debt (Rd) = 4.92%
- Tax rate (Tc) = 25%
$$WACC = \left(\frac{$2.25B}{$2.75B} \times 11.14%\right) + \left(\frac{$500M}{$2.75B} \times 4.92% \times (1 – 0.25)\right)$$
$$WACC = (0.818 \times 11.14%) + (0.182 \times 4.92% \times 0.75)$$
$$WACC = 9.11% + 0.67% = 9.78%$$
Your WACC is approximately 9.78%.
Setting Capital Cost Benchmarks: From WACC to Hurdle Rates
WACC isn’t your hurdle rate; it’s your floor. Your hurdle rate sits above WACC because investors demand compensation for risk beyond just the cost of capital.
Typical hurdle rate framework:
| Investment Category | Risk Level | Premium Over WACC | Example Hurdle Rate |
|---|---|---|---|
| Maintenance/Mandatory | Low | +0% to +1% | 9.78% to 10.78% |
| Operational Efficiency | Low-Moderate | +1% to +2% | 10.78% to 11.78% |
| Strategic Growth | Moderate-High | +3% to +5% | 12.78% to 14.78% |
| Transformational/M&A | High | +5% to +8% | 14.78% to 17.78% |
| Venture/Moonshot | Very High | +10%+ | 19.78%+ |
If your WACC is 9.78%, you might set:
- Hurdle rate for operational efficiency plays: 11.5% (1.72 percentage points above WACC)
- Hurdle rate for strategic growth investments: 13.5% (3.72 percentage points above WACC)
- Hurdle rate for transformational deals: 15.5% (5.72 percentage points above WACC)
This tiered approach creates the logic layer for your CFO investment analysis framework for decision making. Every dollar you deploy faces a threshold calibrated to its risk profile and strategic importance.
Common Mistakes & How to Fix Them
Mistake 1: Using Book Value of Debt Instead of Market Value
The damage: Your debt might be worth 15% less (or more) than what’s on your balance sheet, especially if rates have moved. Your WACC calculation is systematically wrong.
The fix: Pull current market prices from your treasury management system or bond pricing services. If debt is private, calculate YTM based on current interest rate spreads.
Mistake 2: Forgetting to Adjust Beta for Your Capital Structure
Public company betas reflect their current capital structure. If you’re planning a major leverage increase, your systematic risk will rise, and your beta should too.
The fix: “Unlever” the comparable company’s beta, then “relever” it using your target capital structure. This is more precise for strategic planning. Most finance textbooks cover this; it takes five minutes.
Mistake 3: Using Historical Market Returns Instead of Forward-Looking Estimates
Historical equity returns average 10%+, but that doesn’t mean you should expect 10% going forward. Valuations are higher now than they were in 1990.
The fix: Use forward-looking estimates from academic research or major investment banks. In 2026, reasonable estimates range from 8% to 11% depending on your assumptions about GDP growth, profit margins, and valuation multiples. Get this from a source you trust—not a guess.
Mistake 4: Not Updating WACC Annually (or More Frequently)
You calculated WACC in 2024 and haven’t touched it since. Meanwhile, interest rates shifted, your stock price moved 40%, your debt matured, and your beta changed.
The fix: Recalculate WACC at least annually during budget season. More frequently if rates move substantially (>100 basis points) or your capital structure shifts materially (major debt issuance, equity offering, or M&A).
Mistake 5: Setting Hurdle Rates Too Low
If your hurdle rate is only 1% above WACC, you’re almost guaranteeing value destruction when things go wrong (and they do). Projects rarely hit their projections.
The fix: Build in a risk premium commensurate with the risk. Strategic growth investments should demand 300–500 basis points above WACC. Transformational deals, 500–800 basis points. This isn’t being conservative; it’s being realistic.
Integrating WACC into Your CFO Investment Analysis Framework
Here’s where this all connects: WACC is the foundation of a disciplined CFO investment analysis framework for decision making.
At the portfolio level: Calculate your company-wide WACC once, annually. Use it as your baseline.
At the business unit level: If units have different risk profiles, calculate unit-specific WACCs. A fintech subsidiary might have WACC of 12%. A legacy manufacturing division might have WACC of 8%. Adjust accordingly.
In your evaluation scorecard: Weight financial returns against hurdle rates derived from your WACC plus appropriate risk premiums. Projects meeting or exceeding the hurdle advance; those below it are rejected or reworked.
In post-investment review: Compare actual returns to your original hurdle rate. If returns consistently miss, your hurdles might be too aggressive (or your projections too optimistic). If they consistently beat, your hurdles might be too conservative.
Key Takeaways
• WACC is the minimum return your company must generate to satisfy debt and equity investors; it’s non-negotiable and data-driven, not a guess
• Calculate WACC using four components: market value of equity, market value of debt, cost of equity (via CAPM), and cost of debt, weighted and tax-adjusted
• Use current market values, not book values—a 10-year bond issued at 3% isn’t worth par if rates are now 5%
• Beta matters for cost of equity; pull it for public companies, calculate it from comparables for private companies, and update it annually
• Set hurdle rates above WACC by risk premium; maintenance plays might be +1%, strategic growth +3% to +5%, transformational deals +5% to +8%
• Recalculate WACC at least annually; more frequently if interest rates shift >100 basis points or your capital structure changes materially
• Integrate WACC into your CFO investment analysis framework for decision making as the quantitative backbone of your approval thresholds and portfolio decisions
• Revisit your cost of equity assumptions annually—changes in risk-free rates, market risk premiums, and beta all flow through to your WACC and hurdle rates
Practical Implementation: A 30-Day Roadmap
Week 1: Gather data. Pull current stock price, shares outstanding, debt schedule, interest rates, and tax returns. Calculate market values of equity and debt.
Week 2: Estimate cost of equity via CAPM. Determine your risk-free rate (10-year Treasury), find or calculate your beta, and settle on a market risk premium. Calculate Re.
Week 3: Validate cost of debt. Compile your blended interest rate. Confirm effective tax rate from recent filings.
Week 4: Plug into the formula. Calculate company-wide WACC. Run sensitivity analysis (what if rates move 50 bps? What if your capital structure shifts?). Document assumptions. Share with CFO peer group for sanity check.
Within 30 days, you’ve moved from guesswork to data.
Frequently Asked Questions
Q: How often should we recalculate our WACC and capital cost benchmarks?
A: At minimum, annually during budget planning. More frequently if interest rates move materially (>100 basis points), your capital structure shifts significantly (major debt or equity issuance), or your business model changes. In 2026’s volatile rate environment, quarterly reviews aren’t unreasonable for large organizations with substantial debt.
Q: Should we use different WACC numbers for different geographic markets or business units?
A: Yes, if the risk profiles are materially different. A subsidiary in a high-risk emerging market needs a higher WACC than a domestic core business. However, don’t over-fragment; too many WACCs create analysis paralysis. Three to five distinct WACC calculations typically capture enough nuance without becoming unwieldy.
Q: What if our company has no debt? How do we calculate WACC?
A: WACC formula still works; your debt component is simply zero. You’re left with: WACC = Re (100% equity-funded). This is common for high-growth, profitable tech companies. However, your cost of equity (Re) will be your entire hurdle rate, with no tax benefit from debt. Make sure your hurdle rates account for that higher threshold.
Q: How do we reconcile WACC with hurdle rates when building a CFO investment analysis framework for decision making?
A: WACC is the floor; hurdle rates are the threshold. Use WACC as your baseline, then add risk premiums based on project category (maintenance, efficiency, strategic growth, transformational). Your CFO investment analysis framework for decision making uses these risk-adjusted hurdle rates to evaluate whether a capital request creates or destroys value. Projects above the hurdle should advance; those below should be rejected or restructured.