







AI search visibility measurement frameworks give marketers a way to track whether brands show up in ChatGPT, Google AI Overviews, Perplexity, Claude, Gemini, and the growing list of answer engines. In 2026 the conversation moved past “are we getting mentioned?” to “are the numbers reliable enough to drive budget decisions?”
The industry finally has a shared language. The Interactive Advertising Bureau released Measuring Visibility in the AI Era in August 2026. It introduced the 4 P’s hierarchy and split measurement into directional versus decision-grade tiers. That document is the closest thing we have to a standard.
Most brands still fly blind. Only about 16% systematically track AI visibility, according to the IAB itself. The rest bounce between vendor dashboards that disagree on the same brand.
Here’s the practical breakdown of the frameworks that actually work right now—and how to put them to use.
The IAB 4 P’s Framework: The Current Industry Standard
The IAB organizes metrics into a clear hierarchy that mirrors how visibility turns into business value:
- Presence — Does the brand appear at all?
Core metrics: mention rate (share of answers that name the brand), citation rate (share that link to a source associated with the brand), share of voice, and visibility momentum (change over time). - Prominence — How strongly does it appear?
Placement, ranking order inside the answer, and how much of the response draws on the brand’s content versus a passing name-drop. - Portrayal — In what context and with what accuracy?
Sentiment, framing, hallucination rate, and factual inaccuracy rate. This layer is unique to AI. A high mention rate with wrong product details or negative framing is worse than silence. - Persuasion — Does it drive action?
Recommendation strength (passive mention versus active endorsement) and post-citation click-through or engagement signals where available.
The hierarchy matters. Presence without prominence is weak. Prominence without clean portrayal creates risk. Persuasion is the layer that starts connecting to commercial outcomes.


The same framework applies to publishers, with adjusted metrics focused on how their content is cited and used.
Directional vs Decision-Grade Measurement
This is the part most teams skip—and the reason their numbers get challenged.
Directional measurement works for early signals, competitive monitoring, and internal briefings. Lower sample sizes, less rigorous prompt coverage, and lighter documentation are acceptable here.
Decision-grade measurement is what you need before you move money. It requires:
- Documented sample size and query volume
- Broad prompt-type coverage (category, comparison, problem-solution, brand-adjacent)
- Consistent testing cadence and reproducibility checks
- Clear data validation and version control of the prompt set
If a vendor cannot show you these elements, treat the scores as directional only.
Other Practical Frameworks Teams Are Using
Several complementary approaches sit alongside the IAB model:
Share-of-Answers vs Share-of-Mentions
Visibility (share of answers that name you) answers “are we in the conversation?” Share of voice (your mentions divided by all brand mentions) answers “when the engines pick brands, how often do they pick us?” In 2026 many practitioners lead with visibility first, especially for brands still outside most answers.
Layered Evidence Chains
Observe AI answers → detect demand signals (branded search lift, direct traffic, form attribution) → associate with CRM outcomes → estimate financial impact with explicit assumptions. This is the practical bridge into commercial ROI.
Prompt-Library Measurement Contracts
Define the exact numerator, denominator, engines, time window, and formula version before comparing any numbers. Treat the prompt set like a survey instrument—version it and keep it stable for trend tracking.
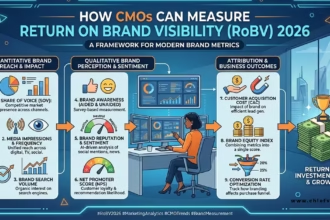
These approaches work best when they feed into broader commercial frameworks. The visibility data becomes far more powerful when connected to the full picture of how CMO can measure return on brand visibility RoBV 2026.
How to Build a Working Measurement System
- Lock a prompt library
Start with 50–150 real buyer questions. Cover category intent, comparisons, problem-solution, and a few brand-adjacent queries. Version-control the set. - Choose engines and cadence
Cover at least ChatGPT, Google AI Mode / Overviews, Perplexity, and one or two others relevant to your audience. Run the same set monthly or quarterly for decision-grade work. - Capture full answers, not just scores
Store the response text, position, citations, and sentiment. Scores alone hide important context. - Separate the four P’s in reporting
Never collapse everything into a single “AI Visibility Score.” Leadership needs to see presence rising while portrayal is slipping. - Add the demand and commercial layers
Overlay branded search trends, self-reported attribution, and pipeline influence. This is where visibility measurement stops being a marketing curiosity and starts influencing budget. - Document everything
Sample size, engines, prompt version, date range, and calculation method. Transparency beats perfect numbers every time.

Common Pitfalls That Kill Credibility
- Treating non-deterministic AI outputs as fixed rankings. Run multiple observations per prompt when possible and report distributions.
- Mixing mention rate and citation rate. Engines often name brands without citing their sites, and vice versa.
- Using vendor scores without understanding the underlying methodology. Two tools can look at the same brand and produce very different results.
- Reporting visibility without any link to demand or revenue signals. The numbers get dismissed as vanity.
What Good Looks Like in Practice
A solid quarterly readout shows:
- Mention rate and citation rate trends on the locked prompt set
- Competitive share of voice movement
- Position and recommendation strength shifts
- Sentiment and accuracy flags
- Corresponding movement in branded search and any available attribution or pipeline data
Keep the methodology appendix available. Lead with the business-relevant story.
AI search visibility measurement is still maturing. The IAB framework gave the industry a common vocabulary and quality bar in 2026. The teams that win treat it as an operating system—not a one-off dashboard project. They measure consistently, document rigorously, and connect the signals to commercial outcomes.
Start with the 4 P’s and a locked prompt library. Everything else builds from there.
Key Takeaways
- The IAB’s 4 P’s framework (Presence, Prominence, Portrayal, Persuasion) is the closest thing the industry has to a standard in 2026.
- Separate directional measurement (early signals) from decision-grade measurement (budget-ready data with documented sample size, reproducibility, and prompt coverage).
- Lock a stable prompt library and version-control it—treat it like a survey instrument, not a casual list of questions.
- Never collapse everything into a single AI Visibility Score. Report the four P’s separately so leadership sees the full picture.
- Visibility data only becomes powerful when connected to demand signals and commercial outcomes, which is exactly where it feeds into how CMO can measure return on brand visibility RoBV 2026.
- Document methodology every time. Transparency beats polished but opaque numbers.
- Start simple: fixed prompts, consistent engines, full-answer capture, then layer on branded search and pipeline influence.
The teams winning in AI search visibility right now are not the ones with the flashiest dashboards. They are the ones who measure the same way every quarter, separate signal from noise, and tie the numbers to business decisions. Build the system once. Refine it. Use it to drive real allocation choices instead of endless internal debates about whose score is “right.”
FAQs
What is the most important AI search visibility measurement framework in 2026?
The IAB’s Measuring Visibility in the AI Era framework, built around the 4 P’s (Presence, Prominence, Portrayal, Persuasion) and the distinction between directional and decision-grade measurement. It gives the industry shared vocabulary and a quality bar that most vendor tools still lack.
How many prompts should a brand track for reliable AI visibility measurement?
Start with 50–150 carefully chosen buyer questions that cover category, comparison, problem-solution, and brand-adjacent intent. Consistency and version control matter more than volume. Decision-grade work requires documented coverage and reproducibility, not just a big number.
Can AI visibility metrics be linked to revenue or pipeline?
Yes, but only through an evidence chain—not direct last-click attribution. Track mention and citation rates, overlay branded search lift and form attribution, then connect to CRM outcomes with explicit assumptions. This is the practical bridge into broader commercial measurement such as how CMO can measure return on brand visibility RoBV 2026.

