







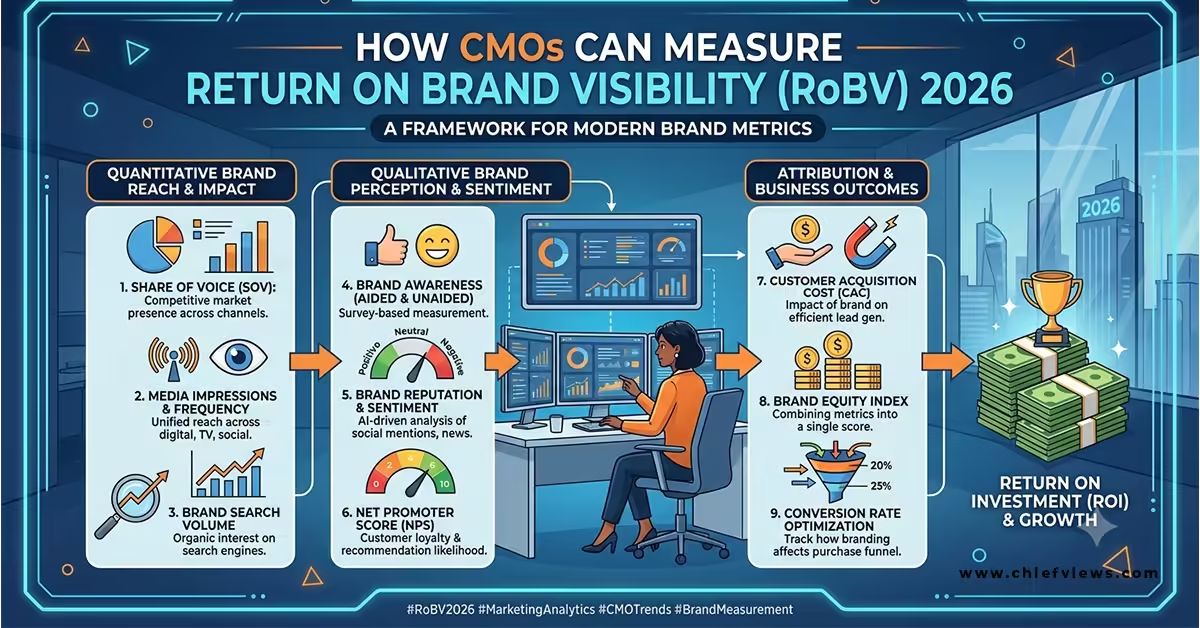
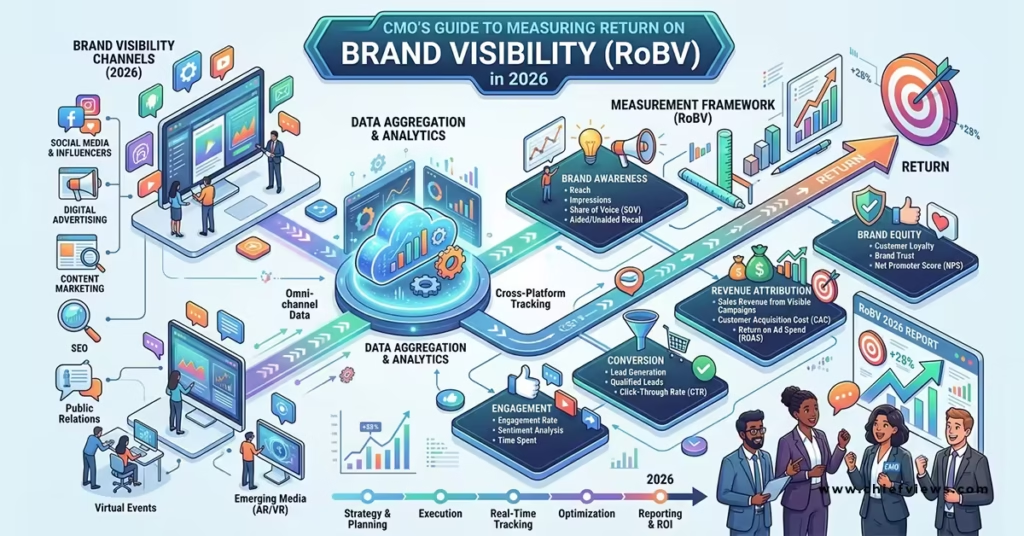
How CMO can measure return on brand visibility RoBV 2026 starts with accepting a hard truth most marketing leaders still dodge. Visibility alone is noise. Return on Brand Visibility (RoBV) is the signal that connects being seen—especially in AI answers, search, and social—to pipeline, pricing power, and revenue. In 2026 that connection is no longer optional.
- RoBV measures how brand presence (mentions, citations, share of voice) converts into measurable commercial outcomes rather than vanity metrics.
- It layers AI visibility signals with traditional brand health and financial indicators so CMOs can defend long-term spend.
- Core drivers include mention rate, recommendation strength, branded search lift, and incremental revenue attribution.
- Without it, brand budgets keep shrinking under short-term ROI pressure.
- Done right, it turns visibility work into a board-ready capital allocation story.
Here’s the thing. Boards stopped accepting “we’re building awareness” years ago. NIQ’s CMO Outlook data shows 84% of marketing leaders now treat ROI as the primary budget metric, while support for pure long-term brand investment has slipped.
That pressure collides with a new reality: buyers discover brands inside AI engines first. The Interactive Advertising Bureau responded in 2026 with a standardized framework built around four Ps—Presence, Prominence, Portrayal, and Persuasion—to clean up the chaos of more than 20 inconsistent AI visibility tools.
RoBV is how you operationalize that framework and prove the dollars.
Why RoBV Matters More Than Traditional Brand Metrics in 2026
Traditional awareness scores still have a place. They just don’t close the loop. What usually happens is a CMO shows rising unaided awareness, finance asks for the revenue line, and the conversation dies.
RoBV forces the connection. It treats visibility as an input and commercial outcomes as the output. In my experience, the brands that win this conversation run a simple evidence chain: observe visibility, detect demand signals, associate those signals with CRM outcomes, then estimate financial impact with explicit assumptions.



Think of brand visibility like oxygen for a fire. Without it the flame dies. But oxygen alone doesn’t cook dinner. You still need fuel, heat, and a timer. RoBV is the full system.
Core Components of how CMO can measure return on brand visibility RoBV 2026
Break measurement into four practical layers. Keep them separate until you present the full story.
- Presence & Visibility Signals
Mention rate (share of relevant AI answers that name your brand), citation rate (share that link to your owned content or trusted third-party sources), and share of voice against a defined competitor set. Use a fixed prompt library of 50–200 buyer questions covering category, comparison, and problem-solution intent. Run the same prompts across major engines on a consistent cadence. - Prominence & Quality Signals
Position within the answer, recommendation strength (passive mention vs active endorsement), sentiment and accuracy (hallucination rate, framing). The IAB framework places these under Prominence and Portrayal for a reason—being named seventh after three competitors is not the same as being the first recommendation. - Demand & Intermediate Signals
Branded search volume lift, direct traffic share, self-reported attribution on forms (“How did you hear about us?”), and consideration/preference movement from brand tracking studies. - Commercial Outcomes
Influenced pipeline, incremental revenue from holdout or geo tests, customer acquisition cost efficiency, price premium retention, and contribution to customer lifetime value.
The kicker is that none of these layers stands alone. A spike in AI mention rate that never shows up in branded search or pipeline is just noise.
Step-by-Step Action Plan for Measuring RoBV
If I were sitting in a new CMO seat tomorrow, this is the sequence I’d run.
Step 1: Define the decision the metric must support.
Budget defense? Competitive response? Channel reallocation? Write the question first. Everything else follows.
Step 2: Build a controlled prompt set.
Select 75–150 real buyer questions. Segment by persona and funnel stage. Version-control the set so results stay comparable quarter to quarter.
Step 3: Establish baselines across engines.
Measure current mention rate, citation rate, and competitive share of voice. Capture full answers, not just scores. Document sample size, engines, and date range.
Step 4: Instrument the demand layer.
Tag branded search in Google Search Console and analytics. Add AI-source options to conversion forms. Track direct traffic trends excluding paid brand campaigns.
Step 5: Connect to commercial data.
Pull CRM pipeline and revenue by cohort. Run simple pre/post or matched-market tests where possible. For bigger bets, layer in marketing mix modeling that includes the visibility metrics as variables.
Step 6: Calculate RoBV with transparent assumptions.
A working formula looks like this:
(Estimated incremental revenue or pipeline value attributable to visibility lift – cost of visibility programs) / cost of visibility programs.
State the attribution window and conversion assumptions clearly. Never claim perfect causality.
Step 7: Report in a one-page executive view.
Lead with the commercial number. Show the supporting visibility and demand trends underneath. Keep the methodology appendix available but out of the main deck.
This process takes most teams 60–90 days to stand up properly. After that it becomes a quarterly rhythm.
Common Mistakes & How to Fix Them
Mistake one: Treating AI visibility as a single score. Different tools produce different numbers because they count differently. Fix: Report the four Ps separately and document the exact methodology every time.
Mistake two: Over-claiming attribution. “Our ChatGPT mentions drove $2M in pipeline” without evidence invites pushback. Fix: Use directional language and show the full evidence chain—visibility → demand signal → commercial outcome.
Mistake three: Ignoring portrayal quality. High mention volume with negative or inaccurate framing destroys trust. Fix: Score sentiment and factual accuracy on every measurement cycle.
Mistake four: Running measurement only after campaigns launch. Fix: Baseline first. Always.
Mistake five: Keeping the data in a marketing silo. Finance and sales never trust numbers they can’t interrogate. Fix: Share the prompt library, raw answer samples, and calculation assumptions.
Practical Comparison of Measurement Approaches
| Approach | What It Captures Well | Blind Spots | Best Used For | Typical Cadence |
|---|---|---|---|---|
| AI Prompt Testing (IAB 4Ps) | Presence, prominence, portrayal in generative answers | Direct revenue linkage | Competitive visibility and content prioritization | Monthly or quarterly |
| Branded Search + Direct Traffic | Demand response after exposure | Doesn’t prove AI was the cause | Early signal of mental availability | Weekly |
| Brand Lift Surveys | Awareness, consideration, preference shifts | Expensive at scale, lagging | Campaign-specific impact | Pre/post major campaigns |
| Incrementality / Holdout Tests | Causal commercial lift | Hard to run continuously for pure brand activity | Budget justification | Selective, high-stakes bets |
| Marketing Mix Modeling | Long-term contribution across channels | Requires clean historical data and statistical expertise | Annual planning and channel allocation | Quarterly or semi-annual |
In practice the strongest RoBV systems combine at least three of these. Pure AI dashboards without the commercial layer don’t survive CFO review. Pure revenue attribution without visibility data misses the leading indicators that let you course-correct early.
How CMO can measure return on brand visibility RoBV 2026 in the Real World
What I’d do if the board demanded proof next quarter: start with the IAB presence and persuasion metrics on a locked prompt set, overlay branded search lift, then run a lightweight geo or audience holdout on the highest-visibility content plays. Translate the observed lift into pipeline value using historical close rates. Present the number with the confidence interval and the assumptions listed in plain English.
That approach has survived more budget reviews than any polished brand-health deck I’ve seen.
The same discipline applies whether you’re defending a $2M brand campaign or a content program aimed at generative engines. Visibility without commercial translation is just activity. RoBV turns it into investment logic.
Key Takeaways
- RoBV connects AI and traditional visibility signals to pipeline and revenue through a transparent evidence chain.
- Start with a fixed, version-controlled prompt library and the IAB four Ps framework.
- Never report a single visibility score; separate presence, quality, demand, and commercial layers.
- Branded search lift and self-reported attribution remain the most practical intermediate bridges in 2026.
- Incrementality testing and marketing mix models provide the causal credibility finance requires.
- Document every assumption. Opaque numbers lose trust faster than low numbers.
- Measurement is a quarterly operating rhythm, not a one-time project.
- The goal is better capital allocation decisions, not perfect attribution.
Most CMOs already have the raw data somewhere. The advantage goes to the ones who assemble it into a clear, defensible story that speaks the language of the P&L. Build the system once, refine it every quarter, and the budget conversations get shorter and more productive. Start with the prompt library and the baseline this month. Everything else builds from there.
FAQs
How does how CMO can measure return on brand visibility RoBV 2026 differ from traditional brand ROI?
Traditional brand ROI often stops at awareness or equity scores. RoBV explicitly includes AI visibility metrics (mention rate, citation rate, recommendation strength) as leading indicators and forces the linkage through demand signals into revenue or pipeline outcomes.
What tools help track how CMO can measure return on brand visibility RoBV 2026?
A combination works best: dedicated AI visibility platforms for the prompt testing layer, Google Search Console and analytics for branded demand, brand-tracking studies for perception, and either holdout testing platforms or marketing mix modeling for commercial attribution. Consistency of methodology matters more than any single vendor.
Can smaller marketing teams realistically implement RoBV measurement?
Yes. Begin with a modest prompt set of 40–60 questions, free or low-cost AI interfaces for manual checks, branded search trends, and simple form attribution. Scale the rigor as budget and stakes increase. Perfect is the enemy of useful.

