










LTV to CAC ratio benchmarks tell you whether your customer acquisition engine is building a profitable business or quietly draining cash.
In simple terms, the LTV to CAC ratio compares a customer’s lifetime value (how much profit they generate over time) against the cost of acquiring them. A strong ratio means every dollar spent on marketing and sales comes back multiplied—often three times or more.
Here’s the quick overview:
- 3:1 is the widely accepted minimum for sustainable growth across most industries.
- Below 2:1 signals trouble—acquisition may be unprofitable.
- 4:1 or higher marks efficient, scalable operations that investors love.
- Payback period (months to recover CAC) matters just as much as the raw ratio for cash flow health.
These LTV to CAC ratio benchmarks matter hugely because raw CAC numbers mean little in isolation. A higher CAC can be perfectly fine if LTV is even stronger. The real question: Does your acquisition spend create real economic value?
Why LTV to CAC Ratio Benchmarks Matter for CMOs and Founders
You can optimize customer acquisition cost optimization for CMOs all day, but without pairing it to LTV, you risk chasing cheap leads that churn fast or overspending on high-quality ones without enough margin.
The ratio keeps you honest. It forces you to look at the full picture—acquisition efficiency plus retention and expansion power. In 2026, with ad costs still elevated and privacy rules limiting targeting, teams that track this metric tightly make smarter budget calls and avoid growth plateaus.
Short version: A solid LTV:CAC ratio gives you permission to scale confidently. A weak one screams “fix retention or targeting before pouring on more fuel.”



How to Calculate LTV to CAC Ratio (No Fluff Version)
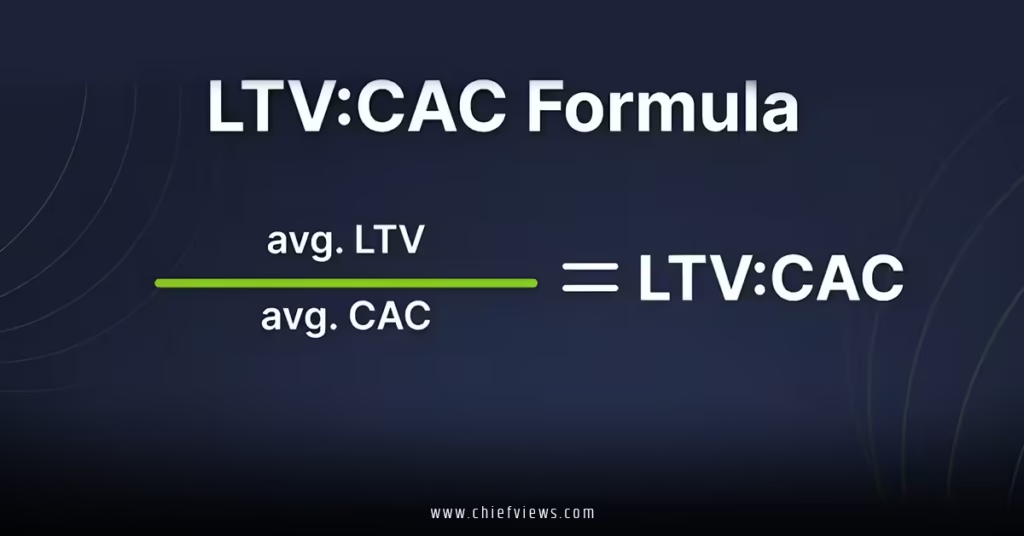
Basic formula:
LTV to CAC Ratio = Customer Lifetime Value (LTV) ÷ Customer Acquisition Cost (CAC)
LTV calculation (common approach for subscription businesses):
LTV = (Average Revenue Per User × Gross Margin) ÷ Churn Rate
Or more precisely for cohorts: average total gross profit from a customer over their entire relationship.
CAC includes all sales and marketing costs (ads, salaries, tools, etc.) divided by new customers acquired.
Use consistent time windows. Track by cohort where possible—customers acquired in the same month—to avoid blending old and new data.
Pro move: Always calculate both blended (company-wide) and cohort-level ratios. Blended can hide problems in newer segments.
Payback period adds critical context: CAC ÷ (Monthly gross profit per customer). Aim to recover costs in under 12 months for most models.
LTV to CAC Ratio Benchmarks in 2026: By Industry and Stage
The classic 3:1 benchmark still holds as the floor for healthy unit economics. But context changes everything.
General rules of thumb:
- Under 2:1 → Red flag. Fix acquisition quality or retention fast.
- 2:1 to 3:1 → Improving but fragile—room for optimization.
- 3:1 to 4:1 → Sweet spot for most sustainable growth.
- 4:1+ → Strong efficiency; you may have headroom to invest more aggressively in acquisition.
- Over 5:1 or 6:1 → Possible under-investment in growth—check if you’re leaving market share on the table.
B2B SaaS Benchmarks
B2B SaaS companies typically target 3:1 minimum, with elite performers hitting 4:1 to 5:1+.
- Early-stage (<$2M ARR): Often around 2.5:1, aiming for 3:1.
- Growth-stage ($2M–$10M ARR): 3:1 to 4:1.
- Scale-stage ($10M+ ARR): 3.8:1 median, pushing toward 5:1+.
Median across B2B SaaS hovers in the 3.2:1–3.8:1 range. Cybersecurity and fintech often clear 4:1–5:1 thanks to higher switching costs and retention.
E-commerce / DTC Benchmarks
E-commerce usually sees tighter margins, so targets sit around 2:1 to 4:1, with 3:1 as the ideal many investors look for at seed stage. Lower churn risk from repeat purchases helps, but returns and competition keep pressure on.
Other Industries (Directional)
- Subscription media or B2C SaaS: Often 2:1–3:1 due to higher churn.
- Enterprise software: Can support 4:1+ with longer contracts and higher ACV.
- Specific niches like adtech have shown ratios up to 7:1 in some analyses, while others like certain services hover near 3:1.
Benchmarks Table: LTV to CAC Ratio by Stage and Segment (2026 Context)
| Category | Minimum Healthy | Strong Target | Notes on Payback Period |
|---|---|---|---|
| Early-stage B2B SaaS | 2.5:1 | 3:1 | ~120 days (tighter cash needs) |
| Growth-stage SaaS | 3:1 | 4:1 | ~90 days |
| Scale-stage SaaS | 3.8:1 | 5:1+ | ~80 days |
| E-commerce / DTC | 2:1 | 3:1–4:1 | Often 1–3 months |
| Cybersecurity / Fintech | 4:1 | 4.5:1–5:1+ | Longer sales cycles but high LTV |
| Median B2B SaaS Overall | 3:1 | 3.5:1–4:1 | 6–12 months typical |
How LTV to CAC Ratio Connects to Customer Acquisition Cost Optimization for CMOs
Strong customer acquisition cost optimization for CMOs directly feeds better ratios. When you lower efficient CAC through better targeting, CRO, or channel mix, the denominator shrinks and the ratio improves—assuming LTV stays stable or grows.
But the smartest CMOs attack both sides:
- Reduce CAC via segmentation, organic channels, and conversion lifts.
- Boost LTV through retention programs, upsell/cross-sell motions, and better onboarding.
The kicker? A great ratio without fast payback can still starve cash flow. Focus on both metrics together.
Step-by-Step: How to Improve Your LTV to CAC Ratio
- Get accurate baselines — Calculate current CAC fully loaded and true cohort LTV. No shortcuts.
- Segment everything — Break down by channel, customer type, and acquisition month. You’ll spot hidden drags.
- Fix the leaky bucket first — Improve retention and expansion. Even small churn reductions lift LTV dramatically.
- Optimize acquisition — Audit channels. Double down on high-ratio performers. Test personalization and creative relentlessly.
- Shorten payback — Speed up time-to-value for new customers. Faster activation = quicker revenue recovery.
- Review monthly — Track trends, not just snapshots. Reallocate budget based on ratio impact.
- Test scenarios — Model “what if” changes to spend or retention before committing big dollars.
Start here if you’re intermediate: Pick one underperforming channel and one retention lever. Measure the ratio delta after 60–90 days.
Common Mistakes When Using LTV to CAC Ratio Benchmarks
- Treating 3:1 as universal law — It’s a guideline. Early-stage or high-margin businesses can tolerate different numbers temporarily.
- Ignoring payback period — A beautiful 5:1 ratio with 24-month payback hurts cash flow more than a 3:1 with 8-month payback.
- Blended vs. cohort — Averaging everything hides problems in new customer segments.
- Under-counting CAC — Leaving out sales salaries or tools makes your ratio look artificially strong.
- Focusing only on acquisition — Neglecting LTV means you’re optimizing half the equation.
- Chasing the number blindly — Cutting spend too aggressively can stall growth even if the ratio improves short-term.
Key Takeaways
- The 3:1 LTV to CAC ratio remains the minimum benchmark for sustainable growth in 2026.
- Elite performers target 4:1 or higher while keeping payback periods tight (under 12 months ideal for most).
- Benchmarks vary significantly by industry, company stage, and business model—context is everything.
- Improving the ratio requires work on both CAC (via optimization) and LTV (via retention and expansion).
- Track cohort-level data and payback alongside the ratio for real decision-making power.
- A healthy ratio gives confidence to scale; a weak one demands immediate fixes.
- Pair this metric with customer acquisition cost optimization for CMOs strategies for maximum impact.
Conclusion
LTV to CAC ratio benchmarks aren’t just investor checkboxes—they’re your clearest signal of whether growth is actually profitable. Hit 3:1 consistently with reasonable payback, and you’ve built something durable. Push toward 4:1+ while optimizing both sides of the equation, and you create real competitive advantage.
Next step: Pull your latest cohort data this week. Calculate the ratio by segment, compare against these benchmarks, and pick one lever—retention or channel efficiency—to move first.
Strong unit economics compound. Get them right, and everything else gets easier.
FAQs
What is the ideal LTV to CAC ratio in 2026?
Most experts still point to 3:1 as the healthy minimum, with 4:1 or better signaling strong performance. Elite B2B SaaS teams often aim higher depending on stage and margins.
Does a higher LTV to CAC ratio always mean better business health?
Not necessarily. Ratios above 5:1 or 6:1 can indicate under-investment in growth. Always check payback period and whether you’re leaving addressable market untapped.
How does customer acquisition cost optimization for CMOs impact the LTV to CAC ratio?
Directly—lowering efficient CAC improves the ratio (smaller denominator). The best optimization also indirectly boosts LTV through higher-quality customers who convert and stay better.
Should early-stage companies worry about hitting 3:1 immediately?
Not strictly. Early on, 2:1–2.5:1 is often acceptable while proving product-market fit. Shift focus toward 3:1+ once you have repeatable acquisition and retention.
What other metrics should I track alongside LTV to CAC ratio?
Payback period, gross margin, net revenue retention (NRR), and cohort-specific churn. These give the full picture beyond a single ratio.


